Visualizing Time: Designing Graphical Representations for Statistical Data - Graham Wills

-20% with code BOOKS
Shipping in 12-18 days
30-day return policy
Art, or Science? Which of these is the right way to think of the field of visualization? This is not an easy question to answer, even for those who have many years experience in making graphical depictions of data with a view to help people understand it and take action. In this book, Graham Wills bridges the gap between the art and the science of visually representing data. He does not simply give rules an ... Full description
You May Also Like

Six Not-so-easy Pieces: Einstein's Relativity, Symmetry, and Space-Time
Richard P. Feynman, Robert B. Leighton, Matthew Sands
-20% with code BOOKS
In stock at our supplier

Six Easy Pieces: Essentials of Physics Explained by Its Most Brilliant Teacher
Richard P. Feynman, Robert B. Leighton, Matthew Sands
-20% with code BOOKS
In stock at our supplier
Behave: The Biology of Humans at Our Best and Worst
-20% with code BOOKS
In stock at our supplier
The Age of Alchemy: How Early Innovators Shaped Modern Chemistry
-20% with code BOOKS
In stock at our supplier
The Secrets of our DNA: How Genetics has Changed the World
-20% with code BOOKS
In stock at our supplier
Why We Sleep: Unlocking the Power of Sleep and Dreams
-20% with code BOOKS
In stock

Astrophysics for People in a Hurry: Essays on the Universe and Our Place Within It
-20% with code BOOKS
In stock at our supplier
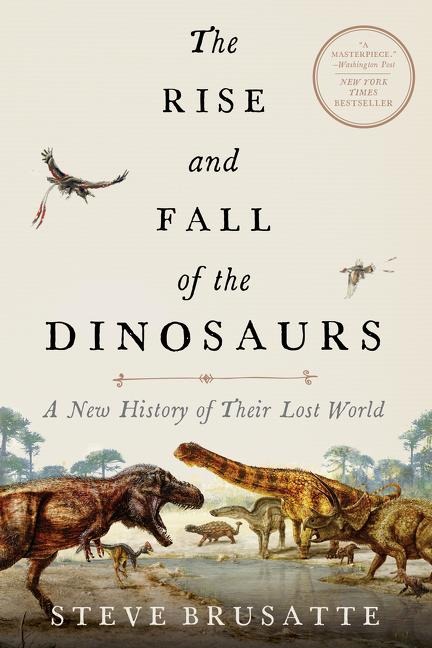
The Rise and Fall of the Dinosaurs: A New History of a Lost World
-20% with code BOOKS
In stock at our supplier
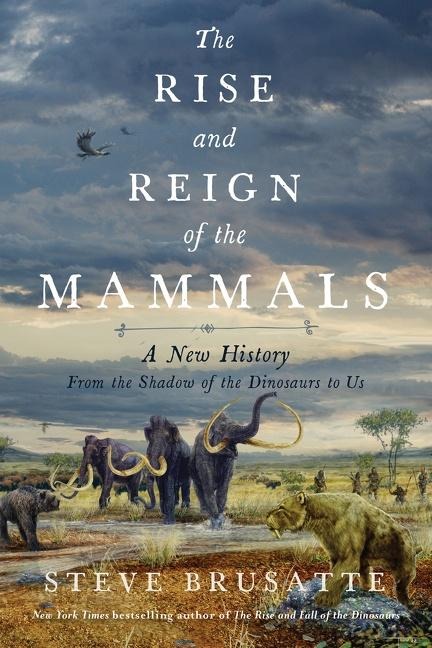
The Rise and Reign of the Mammals: A New History, from the Shadow of the Dinosaurs to Us
-20% with code BOOKS
In stock at our supplier

Determined: The Science of Life Without Free Will
-20% with code BOOKS
In stock at our supplier
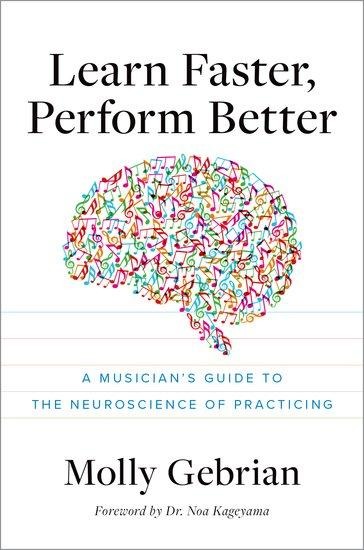
Learn Faster, Perform Better: A Musician's Guide to the Neuroscience of Practicing
-20% with code BOOKS
In stock at our supplier

Beyond Inheritance: Our Ever-Mutating Cells and a New Understanding of Health
-20% with code BOOKS
In stock at our supplier

Thing Explainer: Complicated Stuff in Simple Words
-20% with code BOOKS
In stock at our supplier
Introduction to Quantum Mechanics
Darrell F. Schroeter, David J. Griffiths
-20% with code BOOKS
In stock at our supplier
Factfulness: Ten Reasons We're Wrong About the World--and Why Things Are Better Than You Think
Ola Rosling, Anna Rosling Rönnlund, Hans Rosling
-20% with code BOOKS
In stock at our supplier

Universe: The Definitive Visual Guide
-20% with code BOOKS
In stock at our supplier
Entangled Life: How Fungi Make Our Worlds, Change Our Minds and Shape Our Futures
-20% with code BOOKS
In stock at our supplier

How Far the Light Reaches: A Life in Ten Sea Creatures
-20% with code BOOKS
In stock at our supplier

The Light Eaters: How the Unseen World of Plant Intelligence Offers a New Understanding of Life on Earth
-20% with code BOOKS
In stock at our supplier
Description
Art, or Science? Which of these is the right way to think of the field of visualization? This is not an easy question to answer, even for those who have many years experience in making graphical depictions of data with a view to help people understand it and take action. In this book, Graham Wills bridges the gap between the art and the science of visually representing data. He does not simply give rules and advice, but bases these on general principles and provide a clear path between them This book is concerned with the graphical representation of time data and is written to cover a range of different users. A visualization expert designing tools for displaying time will find it valuable, but so also should a financier assembling a report in a spreadsheet, or a medical researcher trying to display gene sequences using a commercial statistical package.
More Information
| Author | Graham Wills |
|---|---|
| Publisher | Springer New York |
| Series | Statistics and Computing |
| Release year | 2016 |
| Cover type | Softcover |
| EAN | 9781493939244 |